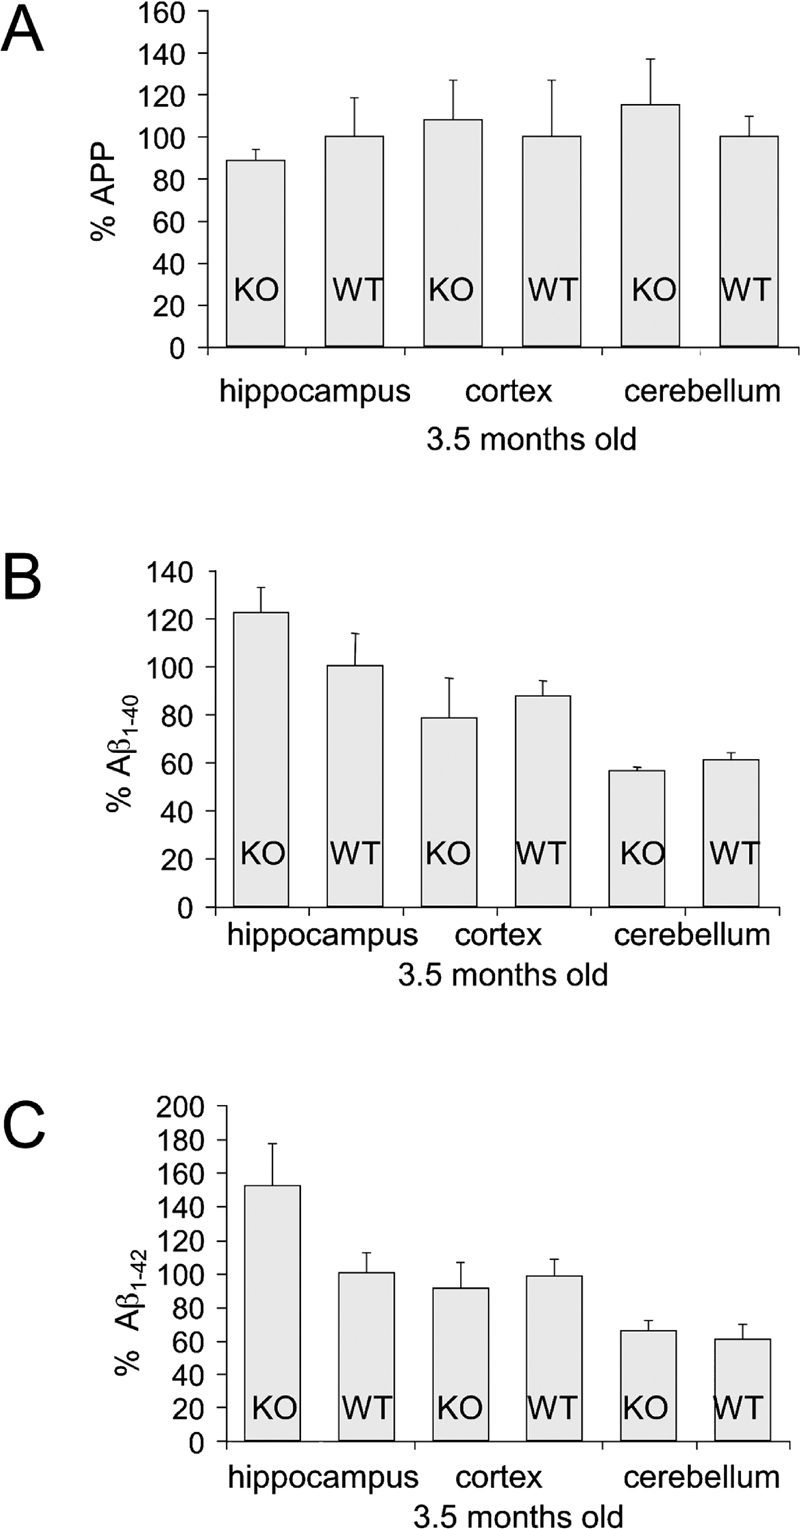
Figure 1.

WT and fmr-1 KO mice (3.5 months old) have equivalent levels of brain APP and Aβ. (A) APP levels in lysates from hippocampus, cortex and cerebellum brain regions of WT and fmr-1 KO mice (25 μg per lane) were assessed by western blot analyses. Phosphorimager units for APP were normalized to β-Actin levels. All WT samples were set to 100%. There was no statistical difference between WT (n = 3) and fmr-1 KO mice (n = 3 mice). (B) Aβ1–40 and (C) Aβ1–42 levels in hippocampus, cortex and cerebellum brain regions of WT (n = 3) and fmr-1 KO (n = 3) mice were assessed by ELISA and presented as a percentage compared to levels in WT hippocampus. The 1.5X increase in Aβ1–42 levels in fmr-1 KO brain was not statistically significant (p = 0.14).
