
Figure 2.
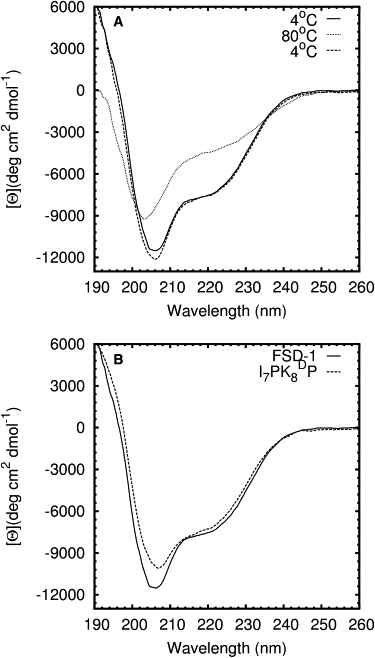
(A) Far-UV CD spectra of FSD-1 at 4°C and 80°C. Spectra were measured at 4°C premelting (solid) and postmelting (dotted). (B) Spectra of FSD-1 and an unfolded FSD-1 double mutant (I7PKDP) at 4°C. DP denotes D-Proline.
Official websites use .gov
A
.gov website belongs to an official
government organization in the United States.
Secure .gov websites use HTTPS
A lock (
) or https:// means you've safely
connected to the .gov website. Share sensitive
information only on official, secure websites.
(A) Far-UV CD spectra of FSD-1 at 4°C and 80°C. Spectra were measured at 4°C premelting (solid) and postmelting (dotted). (B) Spectra of FSD-1 and an unfolded FSD-1 double mutant (I7PKDP) at 4°C. DP denotes D-Proline.