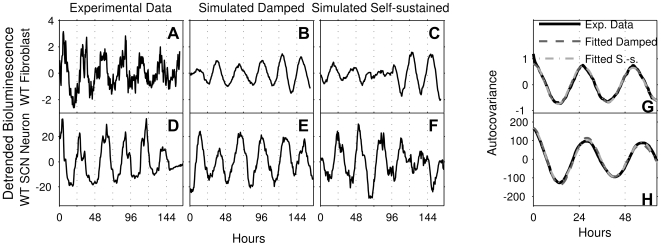
Figure 1. Detrended, mean-centered experimental data, simulations of damped and self-sustained models, and estimated and fitted autocovariance functions.
(A and D). Representative time-series of a WT fibroblast (A) and SCN neuron (D). Raw data were detrended by subtracting a least-squares fit of a second-degree polynomial and then mean-centered. The unit for the bioluminescence is photons per minute. (B and E). Simulations of the damped model (Equation 3) with parameters extracted from the autocovariance estimations of the time-series in panels A and D, respectively. (C and F). Simulations of the self-sustained model (Equation 5) with parameters extracted from the autocovariance estimations of the time-series in panels (A) and (D), respectively. (G and H). Autocovariances were estimated from the time-series in panels (A) and (D), respectively, using an unbiased estimator (black solid curves). Fits to the estimated autocovariances of the theoretical autocovariance functions for the damped model (Equation 4) are shown as dark gray dashed curves. Fits for the self-sustained model (Equation 6) are shown as light gray dashed curves. The fitting procedure is described in Text S1.

