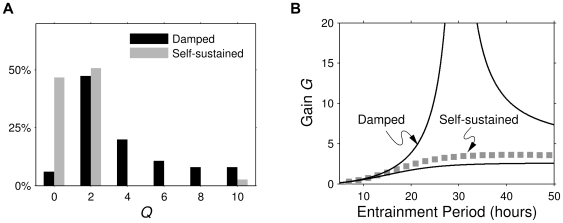
Figure 6. Predictions of the entrained amplitude amplifications of the cells studied.
(A). Histogram of the  factors for the WT SCN neurons from the study of Liu et al. [10]), as calculated from the fitted parameters of the damped and self-sustained models, respectively. The
  factors are a measure of the shape of the frequency response curves; the higher the value, the sharper the resonance peak is. The
  factor can be experimentally measured as the relative gain of the oscillator with respect to an entrainment signal as described in the main text. For resonant cells, i.e. cells where the frequency response curve has a maximum for a frequency other than zero,
  . We assigned a value
  to non-resonant cells. The histogram shows that, if assuming the damped model, far fewer neurons would be non-resonant (6.0% of the neurons), than if we assume the self-sustained model (47%). Also, if assuming the damped model, we often find
  to be over 2 (58%), while this is very rare when assuming the self-sustained model (3.3%). (B). Predicted frequency response curves showing the gains
  , i.e. the amplitude of the driven oscillator divided by that of the forcing amplitude, for one representative
  mutant SCN neuron. The damped model predicts a quite high, sharp frequency response curve (
 ), while the self-sustained model predicts a frequency response curve almost without any resonance peak (
 ). The latter frequency response curve was calculated under the approximation that the self-sustained model under forcing can be approximated as a damped oscillator with the relaxation rate to the self-sustained oscillation acting as the damping rate. The gray squares are the gains calculated from numerical simulations of the self-sustained model with a forcing term conservatively estimated from experimental data. The gains from the simulations agree reasonably well with the gains calculated from the analytical approximation. Parameter values, damped model:
  ,
,  . Parameter values, self-sustained model:
  ,
,  ,
,  . Noise intensities were set to zero.

