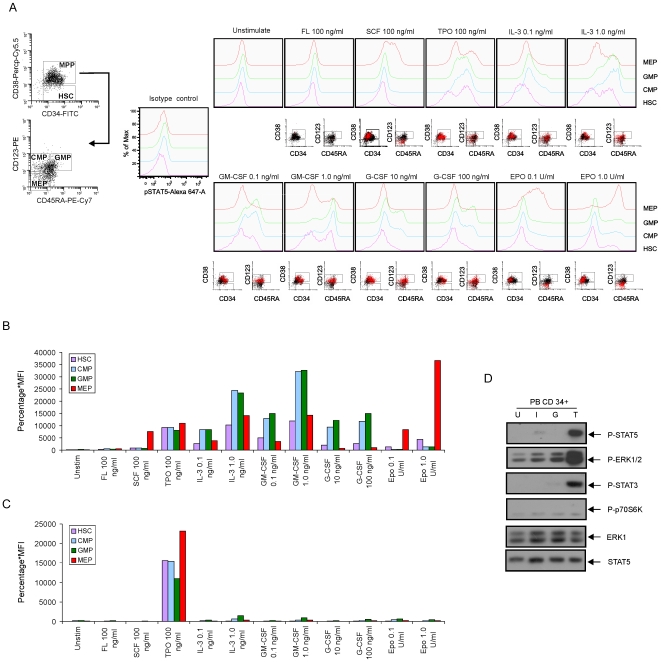
Figure 1. STAT5 phosphorylation in defined stem and progenitor cell populations in normal hematopoietic cells.
(A) Normal CD34+ cells isolated from cord blood (CB) were expanded in HPGM supplemented with 100 ng/ml SCF, FL and TPO for 3 days. Cells were washed and cytokine-depleted in HPGM overnight and then stimulated with indicated cytokines for 15 minutes, followed by intracellular FACS. The scatter properties and gating schemes are shown. The red dots represent the cells with activated STAT5 upon stimulation. (B) Overview of cytokine responses in STAT5 activation in CB CD34+ cells quantified as the percentage of positive cells multiplied with the mean fluorescence intensity (MFI). (C) Normal CD34+ cells derived from mobilized peripheral blood (PB) were suspended in HPGM for 2 hours, followed by cytokine stimulation and intracellular FACS. (D) 1×10⁶/ml PB CD34+ cells were isolated and suspended in HPGM for 2 hours. Cells were stimulated with 1.0 ng/ml IL-3 (I), 100 ng/ml G-CSF (G) or 100 ng/ml TPO (T) for 15 minutes or left unstimulated (indicated as U), after which cell lysates were prepared and subjected to Western blotting using antibodies as indicated.

