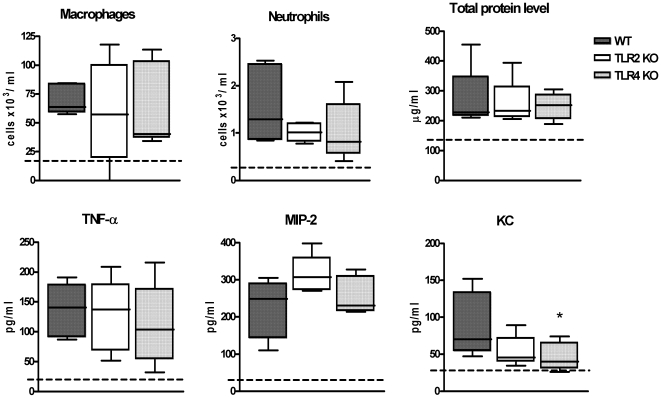
Figure 4. Roles of TLR2, and TLR4 in lung inflammatory response to low dose PLN in vivo.
Macrophage and neutrophil counts, total protein and TNF-α, MIP-2 and KC concentrations in BALF from WT, TLR2 KO and TLR4 KO mice, 6 hours after inoculation of 25 ng/mouse Data are plotted in Box&Whiskers graph (median+interquartile range N = 8 per group) * P<0.05 versus WT mice. Dotted line indicates mean value of PBS-treated mice.

