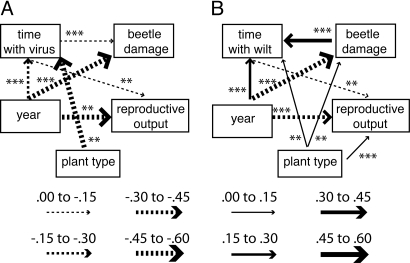
Fig. 4.
Final path analysis including the effects of (A) time with virus and (B) time with wilt disease on reproductive output. Values of standardized regression coefficients are given by line weight and dotted vs. solid lines (see key above). Final models include only significant paths. Significance levels of correlations are denoted by **, P < 0.01 and ***, P < 0.001. (A) χ2 = 7.0, df = 3, P = 0.07, RMSEA = 0.03, AIC = 41.08. (B) χ2 = 0.03, df = 1, P = 0.85, RMSEA = 0, AIC = 38.03

