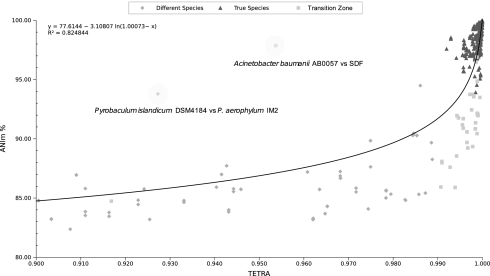
Fig. 3.
Plotted values of TETRA versus ANIm. Triangles show those values that correspond to what taxonomists consider as “true” species according to the DDH values traditionally applied and that have previously been classified. Squares indicate values that appear to be in the transition zone. Note that this is an enlarged (zoomed) portion of the graphic, and values <80% ANI and 0.90 TETRA have been skipped.

