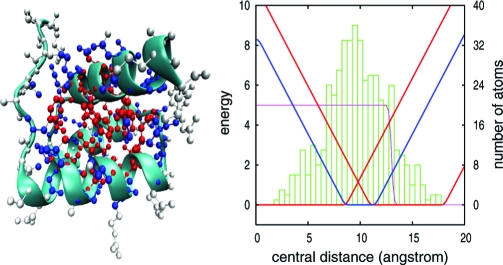
Fig. 1.
Description of the computational experiment. The plot on the Right shows the histogram of the actual burial distribution for 1ENH. Burial-potential wells used for the simulations with three layers, L = 3, are shown in red (inner and outer layers) and blue (middle layer). Atoms in each of these layers are shown in red, blue, and white in the schematic representation on the Left. Note that the layers have different thickness, δi, in order to accommodate the same number of atoms. Energies are measured in units of the simulation temperature. The slope of the nonflat region of the potential determines the burial force modulus, ki, which varies during the simulation. All backbone oxygen and nitrogen atoms receive an energetic penalty when getting closer to the geometrical center without forming a hydrogen bond, shown by the step-like curve (purple). Hydrogen bond formation is quantified for all combinations of donors (nitrogen) and acceptors (oxygen) from the concomitant satisfaction of three geometrical requirements: N–O distance h < 3.0 Å, angle with N–H bond θ < 0.5 rad and angle with C=O bond η < 0.6 rad.

