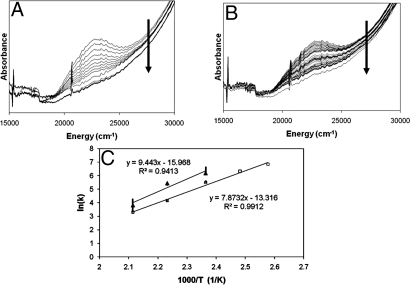
Fig. 5.
Ea and KIE measured from the decay of the 22,700 cm−1 absorption band of O2-activated Cu-ZSM-5 (Cu/Al = 0.54). (A and B) Decay of the 22,700 cm−1 absorption band of an O2 activated Cu-ZSM-5 (Cu/Al = 0.54) measured during reaction at 175 °C with CH4 (A) and C2H4 (B). The arrow on the figures shows the evolution in time. Time interval between two spectra is 15 seconds. (C) Arrhenius' plots for CH4 (open squares) and C2H4 (filled triangle).

