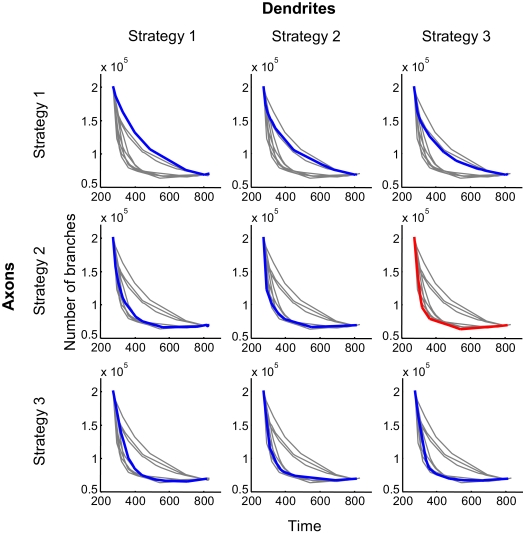
Figure 4.
Performance boundaries for different combinations of branching strategies used by axons and dendrites. The performance boundary depicts the minimal number of branches that are required to establish connectivity with a given level of precision after a given length of time. Alternatively, it provides the minimal time required to achieve the configuration with a given level of precision using a predetermined number of branches. In each panel, the colored curve (blue or red) represents the boundary for a specified combination of branching strategies. The boundaries for other combinations are shown in grey, for comparison. The red curve depicts the optimal performance boundary that corresponds to the combination of Strategies 2 and 3, used by axons and dendrites, respectively.

