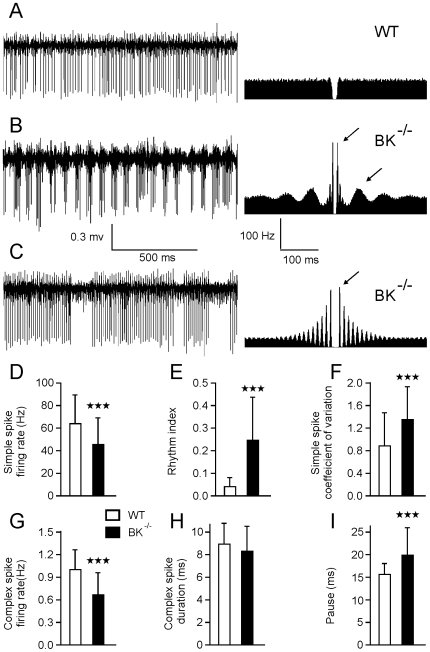
Figure 2. Purkinje cells in BK−/− mice reveal different modes of simple spike firing.
(A) Representative extracellular recording of a Purkinje cell in a WT (A) and a BK−/− (B–C) mouse with corresponding autocorrelograms computed on a 120-s sample. Arrows indicate peaks that demonstrate rapid (C) and double rhythmicity (B). Central peak artifacts in the autocorrelograms were deleted, as in the following figures. (D–I) Bar graphs of simple spike firing rate (D), rhythm index (E), CV (F), and of complex spike firing rate (G), duration (H), and pause (I) in WT (n = 35) and in BK−/− (n = 48) Purkinje cells. Bars indicate standard deviation. (In this figure and in the following ones, * = p<0.05, , *** = p<0.0001).

