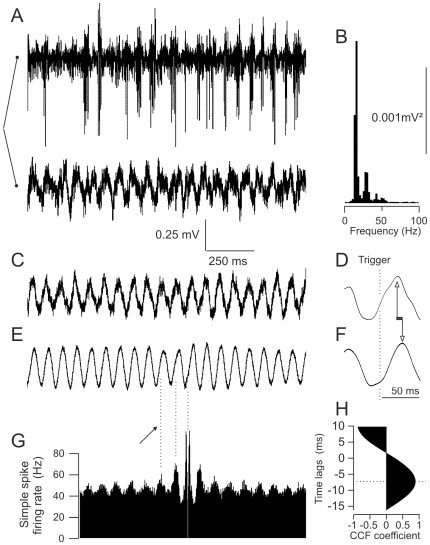
Figure 3. Cerebellar cortices of BK−/− mice present a LFPO in the beta-range phase-locked with both the simple and complex spikes.
(A–B) Simultaneous recording of a LFPO and a Purkinje cell (250 µm-apart along the parallel fiber axis) and Fast-Fourier-Transform of the LFPO. (C–F). Spike-trigger averaging of the LFPO using the complex (C–D) and the simple (E–F) spike. Note the phase-difference in the phase-locking of complex and simple spikes. The smoother aspect of the simple spike triggered wave is due to the much greater number of triggering spikes. Traces D and F are low-pass filtered (<500 Hz); note the difference in time scale. Arrows indicate the time lag. (G) Simple spike autocorrelogram of the Purkinje cell illustrated in A. Arrow indicates the correspondence between low frequency rhythmicity and LFPO wave. (H) Cross-correlation function between the non-filtered simple and complex spike triggered averaging, confirming the time lag around 7 ms.

