Fig. 1.
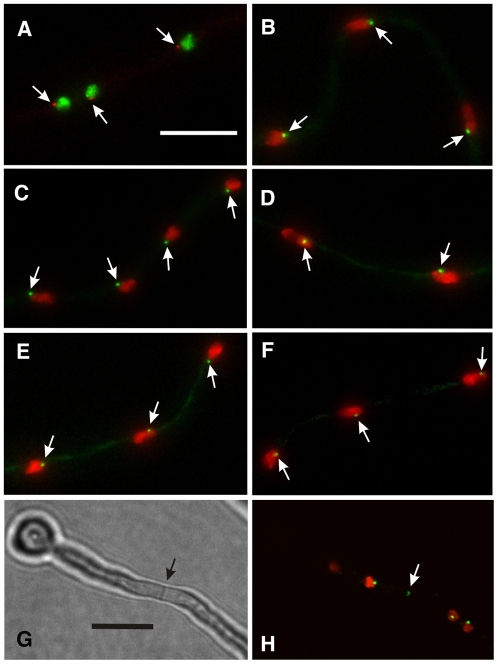
Localizations of γ-tubulin and putative GCPs to the SPB and septum. All panels except G are projections of Z-series stacks. A-F were taken with widefield microscopes. (A) γ-tubulin-mCherry and histone H1-GFP. (B) GCPB-GFP, histone H1-mCherry. (C) GCPC-GFP, histone H1-mCherry. (D) GCPD-GFP, histone H1-mCherry. (E) GCPE-GFP, histone H1-mCherry. (F) GCPF-GFP, histone H1-mCherry. GCPF fluorescence is very weak and barely brighter than the hyphal background fluorescence. Arrows in each panel indicate the SPB location of γ-tubulin or the relevant GCP. The variation in nuclear size is due to the cell-cycle stage at which the images were captured. The nuclei in C, for example, are in G1 and the nuclei in D are in late G2. (G,H) Images were taken with an Ultraview Vox spinning disk confocal microscope and show the same field. (G) Bright field image of a portion of a long germling that has formed a septum (arrow). (H) GCPC-GFP and histone H1-mCherry. In addition to the spindle pole bodies, GCPC localizes in relatively faint dots at the septum (arrow). Scale bar in A: 10 μm (A-F). Scale bar in G: 10 μm (G,H).

