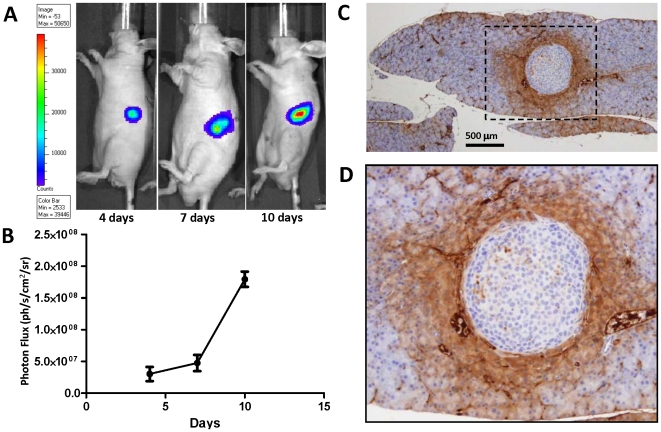
Figure 1. An orthotopic pancreatic tumor xenograft model in mice.
(A) Bioluminescence images of mice with orthotopic tumors obtained at 4, 7, and 10 days post intra-pancreatic injection of L3.6pl/GL+ human pancreatic carcinoma cells. (B) Growth dynamics of the orthotopic L3.6pl/GL+ tumors based on the photon flux measured from BLI images obtained from the left mid-abdominal area. (C) HIP/PAP expression in peritumoral pancreatic acinar cells and microvesels (×20; bar = 500 µm); the black dotted line defines the area shown at higher magnification (×40) in panel (D).

