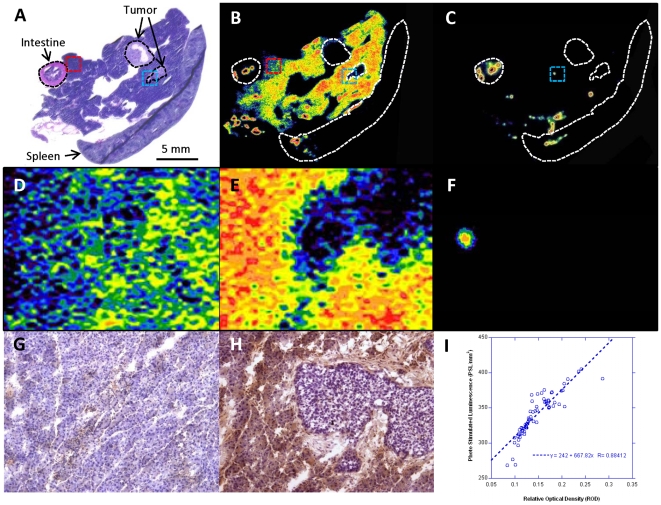
Figure 4. Comparison of ex vivo [18F]FEDL autoradiography and HIP/PAP expression.
(A) H&E stained section and (B) color-coded autoradiographic image of [18F]FEDL binding in an adjacent section obtained from the same tissue block including: pancreas, spleen and intestine and two small orthotopic pancreatic carcinoma lesions outlined by the dotted lines (bar: 5 mm) and indicated by the arrows; a red dotted line outlines the area shown at ×15 higher magnification in panel D (autoradiography) and panel G (IHC) with low level of HIP/PAP expression; a blue dotted line outlines the area shown in panel E (autoradiography) and H (IHC) with high level of HIP/PAP expression. (C) autoradiographic image of an adjacent section blocked with 1mM lactose prior to exposure to [18F]FEDL. A non-specific binding is observed to the intestinal content and to the vascular- or ductal-appearing structures in the pancreras and spleen. (F) ×15 magnified autoradiographic image of the region outlined by the blue dotted rectangle in panel C, demonstrating some non-specific binding of [18F]FEDL. (I) A scatter plot and linear regression analysis of relationship between the magnitude of HIP/PAP expression (IHC densitometry, ROD) and [18F]FEDL binding (autoradiography, PSL/mm2); an almost linear relationship is observed (r = 0.88).

