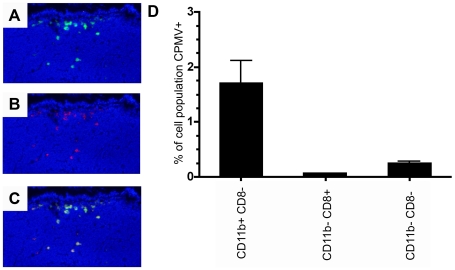
Figure 6. In vivo uptake of CPMV particles in intestinal PP.
(A) Fluorescence microscopy image showing CPMV-AF488 particles (green) penetrating the dome region of an intestinal PP. (B) Fluorescence microscopy image showing UEA Rhodamine M cell marker (red). (C) Merge A and B. (D) FACS analysis of CD11c positive PP DCs. CPMV positive lymphoid, myeloid and double negative PP DCs expressed as a percent of each respective PP DC subpopulation.

