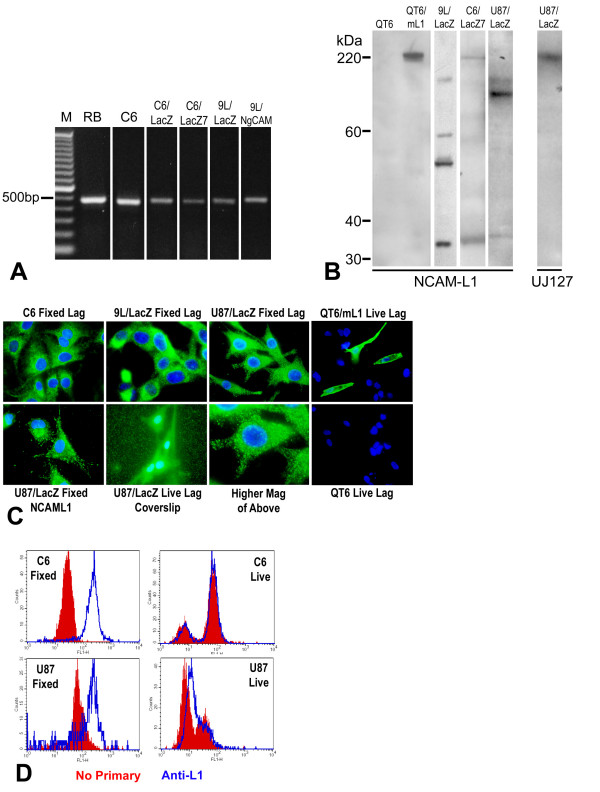
Figure 2.
L1 is expressed and proteolyzed in glioma cell lines. (A) RT-PCR was performed on glioma cell lines to detect L1 mRNA. PCR primers were designed as described to generate a 461 bp L1 PCR product. Rat glioma cell lines C6, C6/LacZ, C6/LacZ7, 9L/NgCAM, 9L/LacZ exhibited the 461 bp band after RT-PCR. Rat brain (RB) served as a positive control for L1 mRNA expression. No-reverse transcriptase control reactions were run for every sample, and bands were not present in those lanes (not shown). (B) Western blot analysis of L1 expression. NCAM-L1 antibody (left panel) recognized L1 in rat glioma cell line 9L/LacZ, C6/LacZ7, and human glioma U87/LacZ cells and resulted in lower than full length bands. The approximate weight 32 kDa band indicates proteolysis by ADAM10 in all 3 cell lines. Further proteolysis in 9L/LacZ and U-87/LacZ cells is indicated by additional bands of lower than 200 kDa. Plain quail QT6 and mouse L1-expressing QT6 cells were used as negative and positive controls, respectively. Antibody UJ127 (right panel) against human L1 ectodomain was used for analysis of L1 in U87/LacZ human glioma cell line to determine if the complete ADAM10 ectodomain cleavage product was present, and the large fragment (approx. 220 kDa) indicates its presence. (C) Rat glioma cell lines C6, 9L/LacZ and the human glioma cell line U87/LacZ were immunostained on coverslips with anti-L1 antibodies. Lagenaur polyclonal and NCAM-L1 revealed bright punctate intracellular staining for L1 in fixed and permeablized cells in all 3 cell lines but surface staining was not detectable. Small punctate staining could be visualized on the level of the coverslip outside the cell boundaries when U87/LacZ cells were stained live using Lagenaur (lower middle-left panel). The lower middle-right panel is a higher magnification of upper right panel. The two rightmost panels show quail QT6 transfected with mouse L1 cDNA (top right) or untransfected QT6 (bottom right) immunostained live with the Lagenaur polyclonal antibody, with 3 bright surface stained transfected cells (top right). (D) FACS analyses of fixed (left two panels) and live (right two panels) cells. Fixed and permeablized cells exhibited distinct positive peaks of L1 immunofluorescence compared to no-primary control cells. However, live cells exhibited nearly identical fluorescence profiles to the no-primary control cells indicating little, if any, cell surface L1.

