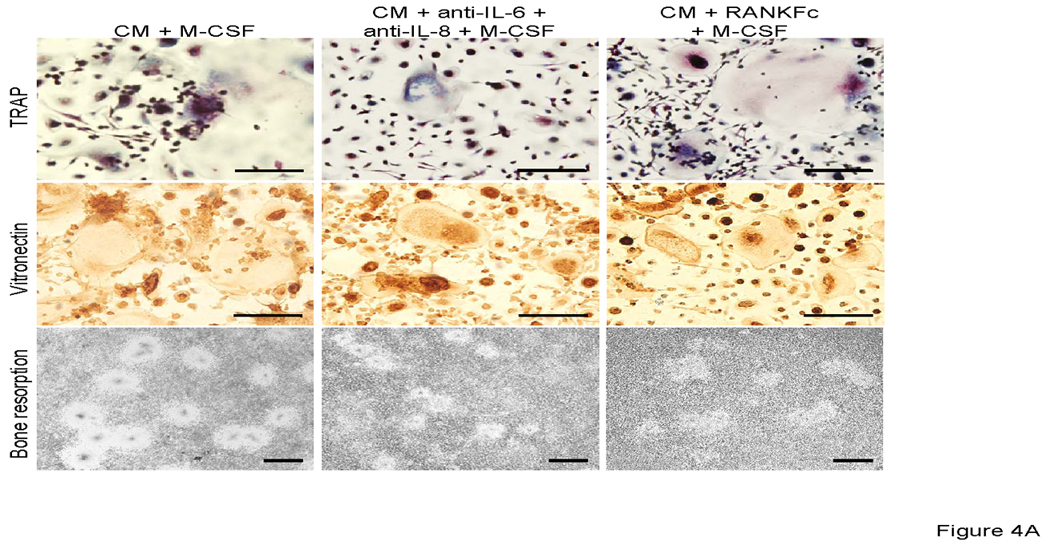
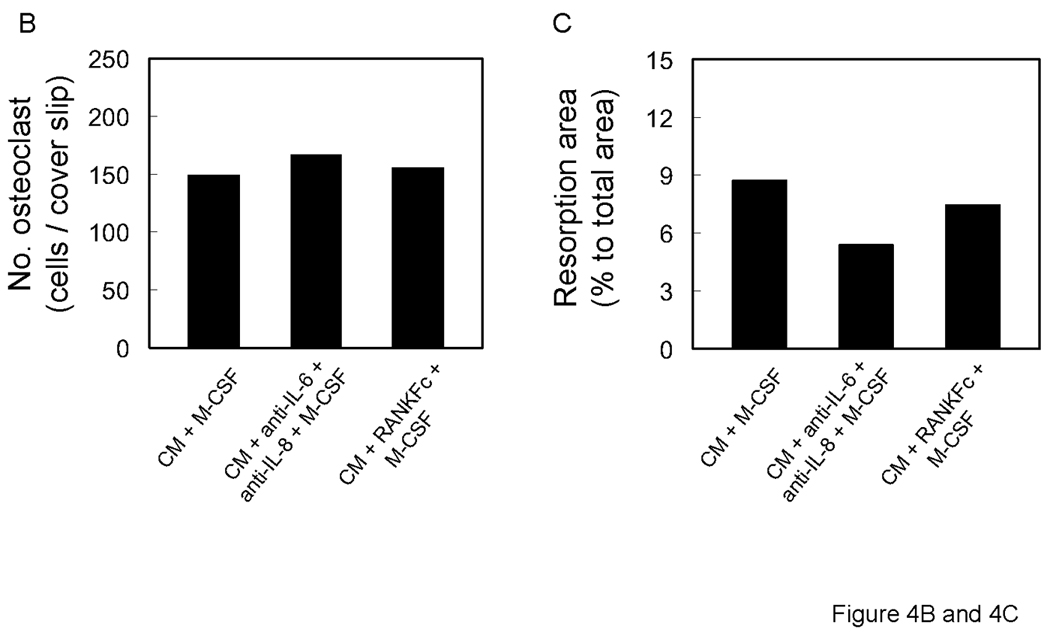
Figure 4.


A. Representative micrographs of TRAP positive (upper panels), vitronectin positive (middle panels) multinuclear cells and bone resorption (lower panel). 0.5×10⁶ CD11b+ cells were all cultured with M-CSF (25 ng/ml) and neutralizing antibodies for IL-6 and IL-8 and RANKFc with 50% conditioned media from PC-3 cells. Graphical representation of number of osteoclast-like multinuclear TRAP positive cells (B) and bone resorption area (C).
