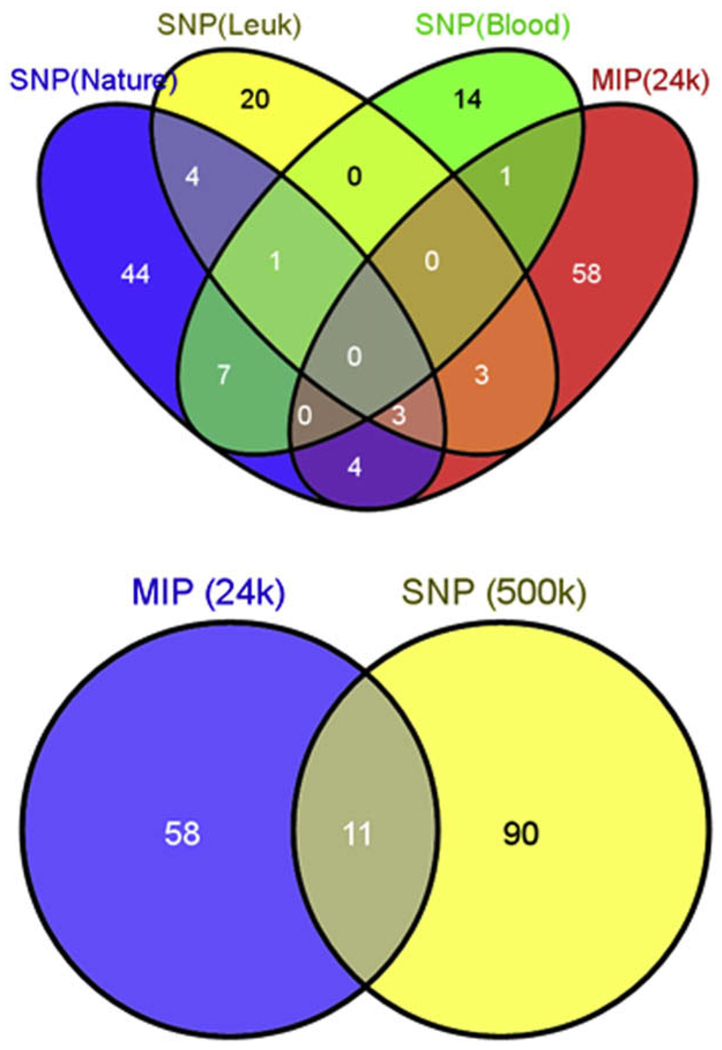
Fig. 3.
Venn diagram of recurring copy number aberrations (CNAs) detected by single-nucleotide polymorphism arrays vs. molecular inversion probe arrays (SNP vs. MIP). Top: Comparison of recurring CNAs reported in supplemental data of previously published Affymetrix SNP 500 k arrays on childhood leukemia cohorts vs. those detected by MIP analysis. Bottom: Recurring CNAs in the SNP studies vs. the MIP platform overall. Note equivalent overlap between platforms in the two diagrams. Sources: The SNP(Nature) data are from Mullighan et al., 2007 [10], published in Nature; the SNP(Leuk) data are from Kuiper et al., 2007 [11], published in Leukemia; and the SNP(Blood) data are from Kawamata et al., 2008 [12], published in Blood. MIP (24 k) indicates MIP cancer panel data with 24,000 probes; SNP (500 k) indicates data from the three combined Affymetrix 500 k studies. Figures created using: Oliveros, JC. (2007) VENNY. An interactive tool comparing lists with Venn Diagrams. http://bioinfogp.cnb.csic.es/tools/venny/index.html.

