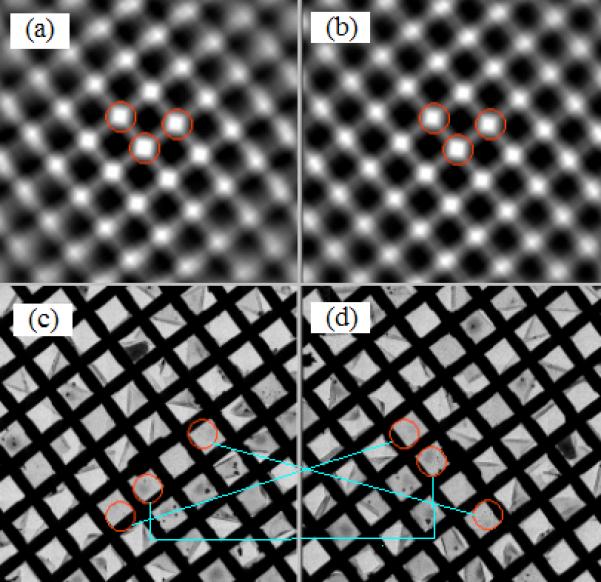
Figure.4.

Correlative analysis of atlas maps constructed before and after specimen rotation to determine the rotational alignment parameters. Atlas maps were composed of 121 images of 1024 × 1024 pixels with 4x on-chip binning and 0.1s exposure acquired with a GATAN UltraCam CCD camera. The magnification was 480x on FEI TF30 Polara G2 electron microscope. (a) Auto-correlation image of the atlas map before specimen rotation. (b) Auto-correlation image of the atlas map after specimen rotation. (c) Atlas map before specimen rotation. (d) Atlas map after specimen rotation.
