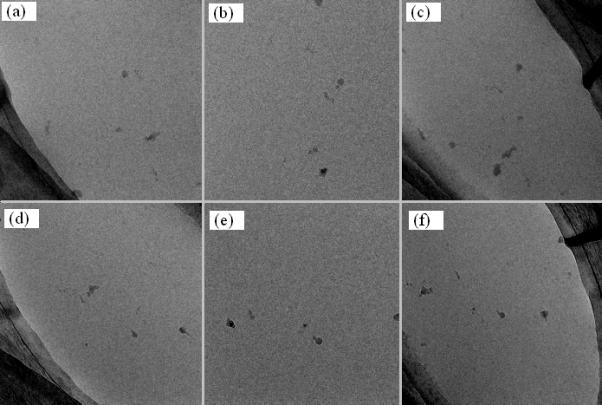
Figure 6.

A pair of tomographic tilt data sets collected before and after specimen rotation. The top row displays three tilted images before specimen rotation and the bottom rows shows the counterparts at the same angles after specimen rotation. (a) α = –60°, (b) α = 0°, (c) α = +60°, (d) α = –60°, (e) α = 0°, (f) α = +60°
