
Fig. 2.
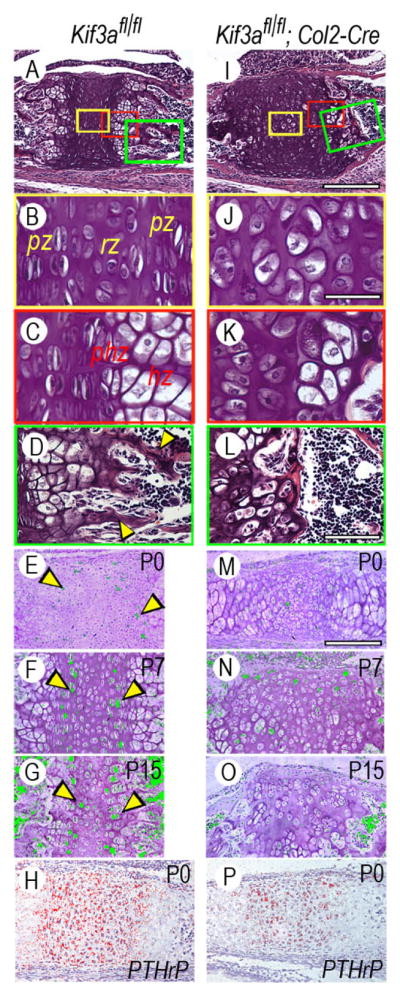
Synchondrosis growth plate organization and chondrocyte proliferation are deranged in Kif3a-deficient cranial bases. (A–D) Parasagittal sections of P7 control spheno-occipital synchondrosis. Note the presence of resting (rz), proliferative (pr), pre-hypertrophic (phz) and hypertrophic (hz) growth plate zones and primary bone spongiosa (arrowheads in D). Boxed colored areas in A are shown at higher magnification in B–D. (E–G) Presence and location of proliferating chondrocytes in control P0, P7 and P15 so synchondroses as revealed by histone 4C gene expression by in situ hybridization. Hybridization signal was given an artificial color for illustration purpose. Note the presence of two well-defined proliferative zones indicated by arrowheads flanking a central resting zone. (H) PTHrP gene expression in control P0 synchondrosis that characterizes resting and proliferative zones. (I–L) Parasagittal sections of P7 Kif3a-deficient so synchondrosis showing that the growth plate zone structure is totally abnormal (J–K) and that there is a near absence of primary spongiosa (L). (M–O) Near absence of histone 4C-expressing proliferating chondrocytes in Kif3a-deficient synchondroses. (P) PTHrP gene expression in Kif3a-deficient synchondrosis Scale bars: 300 μm for A,I; 40 μm for B,C,J,K; 80 μm for D,L; and 150 μm for E-H and M-P.