
Fig. 6.
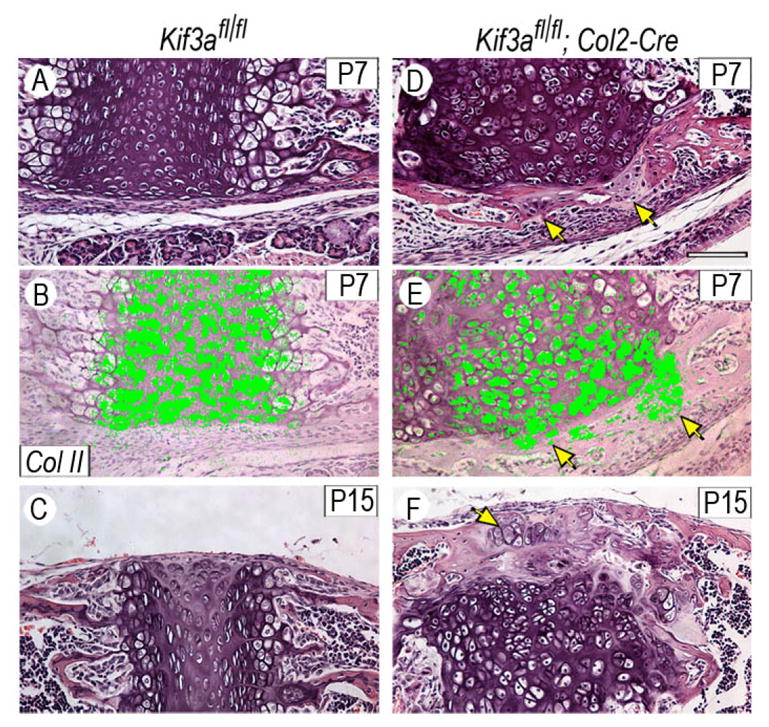
Presence of ectopic cartilage masses near Kif3a-deficient synchondroses. Sections of P7 and P15 control (A–C) and mutant (D–F) synchondroses were stained with H&E or processed for in situ hybridization analysis of collagen II expression. Ectopic cartilaginous masses forming in mutant specimens (arrows in D–E) are recognizable by their typical histology and expression of collagen II. Such phenomenon is never observed in control specimens where the chondro-perichondrial boundary is clear and un-violated (A–C). Scale bar is 75 μm for A–F.