
FIG. 3.
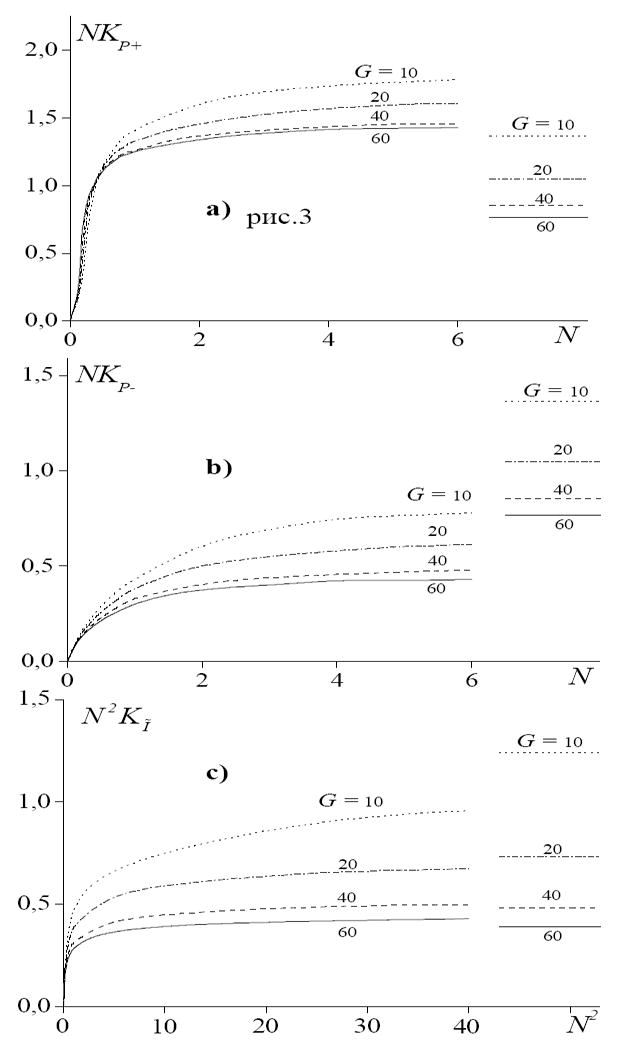
Saturation curves at the focus for dimensionless peak pressures (NKP± ~ p±F, a, b) and intensity Ĩ (N2KĨ~ IF, c). The value of parameter N is proportional to the source pressure output p0, the curves are presented for various values of G = 10, 20, 40, 60. Shown on the right are the approximate saturation values given by the analytic solution, Eq. 5.