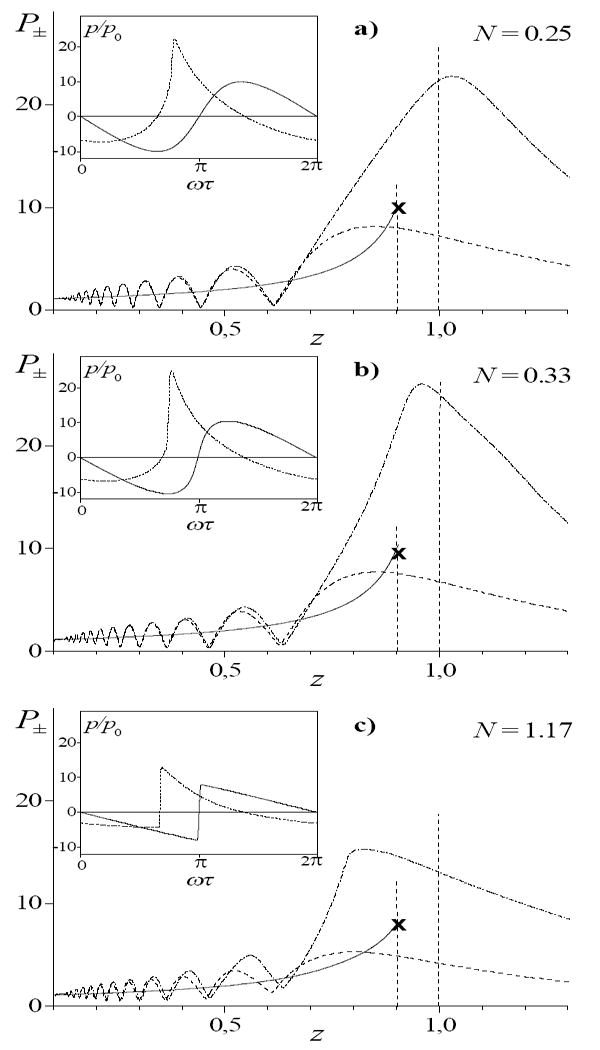
FIG. 5.

Distributions of the dimensionless peak pressures P+ and P− along beam axis (G = 10) for various values of nonlinear parameter N = 0.25 (a), 0.33 (b), and 1.17 (c). Solid lines correspond to the peak pressure in one-dimensional spherically convergent wave (P+ = P−); dashed lines – to the peak negative P− and dash-dotted line – to the peak positive P+ pressure in nonlinear beam. Shown in small frames are waveforms calculated in the geometrical focus for a beam and at the distance 1/G from the focus towards the source for one-dimensional spherically convergent wave.
