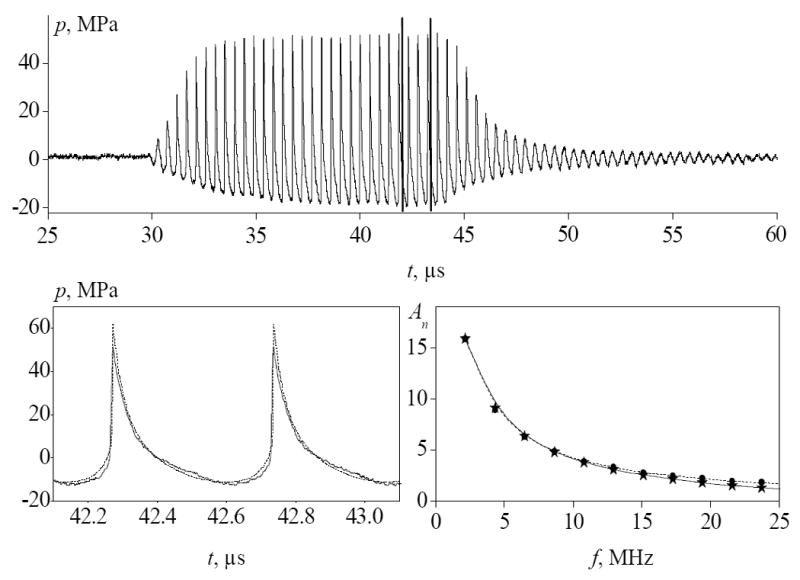
FIG. 7.

Comparison of measured data (solid lines) with the results of numerical modeling (dashed lines) for the pressure waveform at the focus: (a) - the measured signal; (b) - two periods in the wave profile between vertical lines on the graph of the measured signal, and (c) - the corresponding spectrum. Here An is the amplitude of the n-th harmonic of an initial wave, A1 = p0 at z = 0. Source parameters are: 22.5 mm radius, 44.4 mm focal length, 2 MHz frequency, and 0.4 MPa initial pressure, that correspond to the values of G = 48 and N = 0.25.
