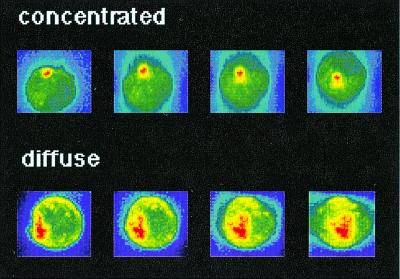
Figure 1.
Definition of I-Ek accumulation phenotypes. A three-dimensional reconstruction of the I-Ek-GFP intensity of transfected A20 cells in T cell/APC couples is shown. Increasing I-Ek density is color encoded from blue through green and yellow to red. The color scales have been applied to each of the two cells separately to cover the whole intensity range of the cell. Thus similar colors do not correspond to the same intensity when the two cells are compared. To analyze the amount of accumulation, the difference in absolute intensity values between the interface and the sides and back of the cell is used. The position of the T cell, as identified in a parallel bright field image and visible as a flattening of the APC (in the left-most panels) is on top of the APC for the “concentrated” and at left for the “diffuse” pattern. The four panels are related to each other by a 30° rotation around a horizontal axis for the “concentrated” and a vertical axis for the “diffuse” accumulation pattern.

