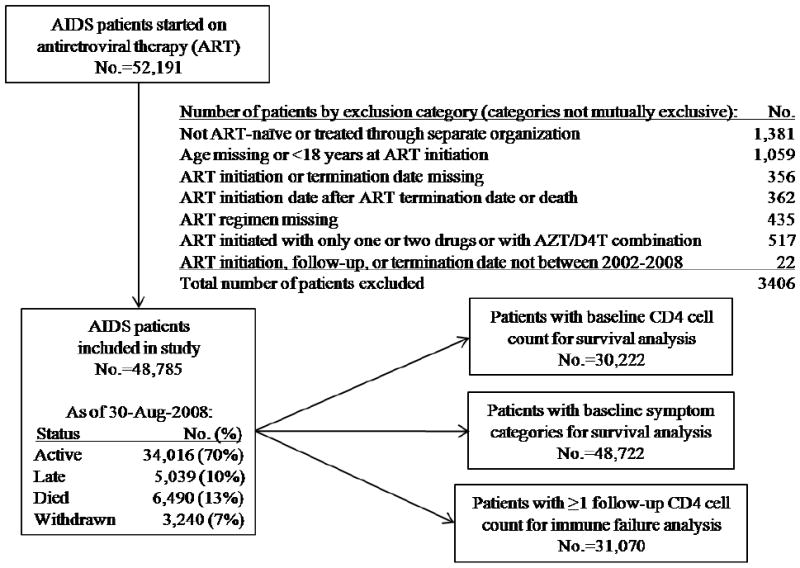
Figure 1.

Schematic diagram of the 52,191 total patients in the National Free Antiretroviral Treatment Program, China, June 2002 – August 2008.
Note: Active patients are those without a treatment termination date recorded who were last seen within six months of August 30, 2008. Late patients are those without a treatment termination date recorded but had not been seen within six months of August 30, 2008. Withdrawn patients are patients with a treatment termination date recorded for any reason.
