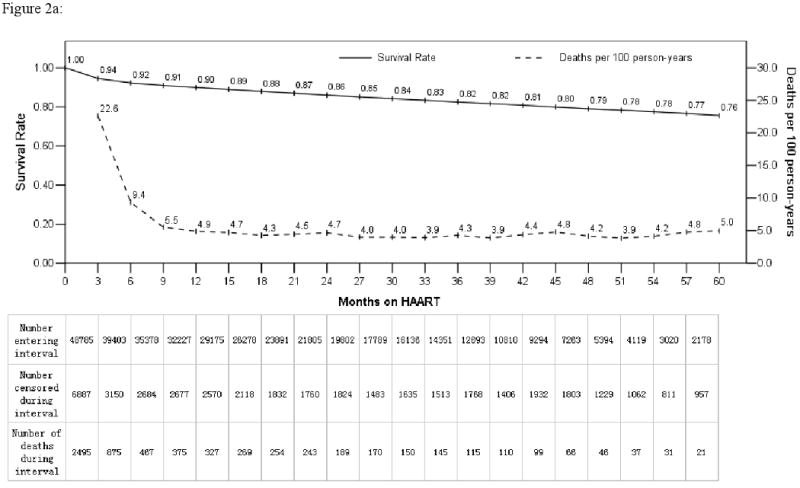
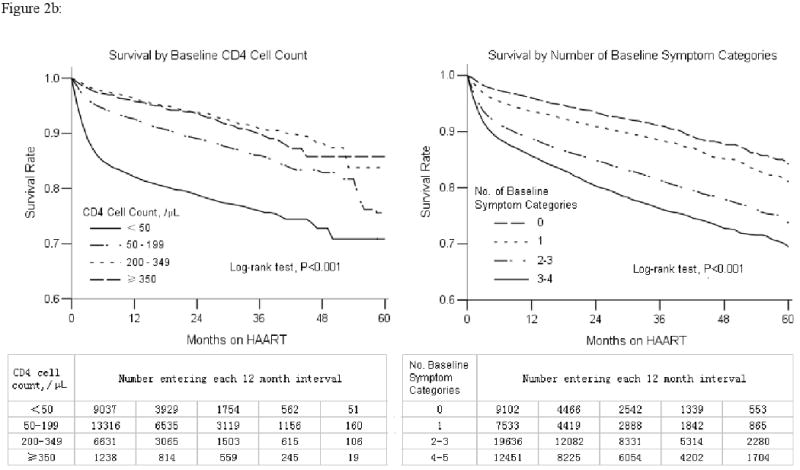
Figure 2.


Overall change over time by mortality and life table survival rate (2a) and life table survival stratified by baseline CD4 cell count and number of baseline symptom categories (2b) following treatment initiation for previously antiretroviral therapy naïve adult AIDS patients in the National Free Antiretroviral Treatment Program, China, June 2002 – August 2008. Mortality rate shown reflects each three month interval.
