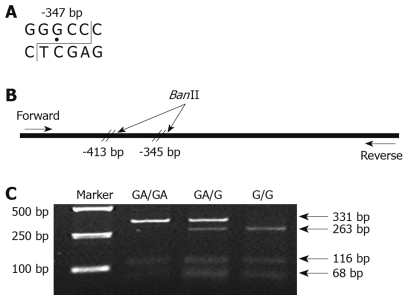
Figure 1.
Genotyping analysis of the CDH1 -347G→GA polymorphism by PCR-RFLP analysis. A: Structural diagram of the restriction enzyme analysis for BanII; B: Schematic overview of the E-cadherin gene promoter PCR fragment and the locations of the BanII restriction enzyme sites; C: RFLP analysis of the -347G→GA polymorphism using BanII digestion. GA/GA homozygote: 332 and 116 bp; GA/G heterozygote: 332, 263, 116 and 68 bp; G/G homozygote: 263, 116 and 68 bp.

