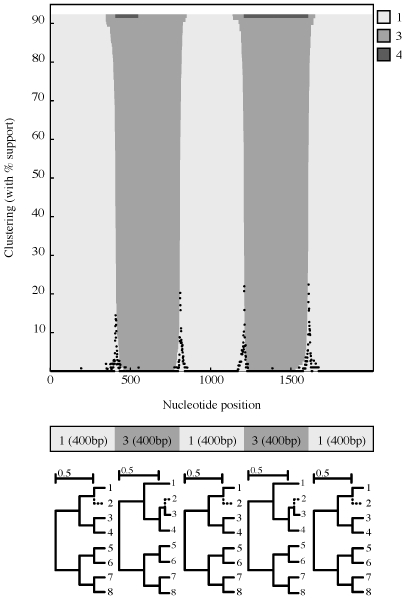
Figure 4. A simulation scenario example.
One of the simulation scenarios used to asses our detection method with the results over  replicates (scenario 5/close in Table 2). The query sequence (2) was simulated to move from reference lineage 1 to reference lineage 3 every 400 bp as shown in the tree panel. The clustering chart depicts model and replicate averaged support for assigning the query sequence to a particular reference lineage, as estimated by the genetic algorithm over 100 simulated data replicates, whereas black impulse plots indicate the inferred placements of breakpoints. The y-axis does not reach
  because each replicate contributes the model averaged support for the best inferred mosaic type–a value that is
  ; the upper limit on the y-axis is, therefore, the mean (over replicates) model-averaged support for the best-fitting mosaic (0.92 in this case).

