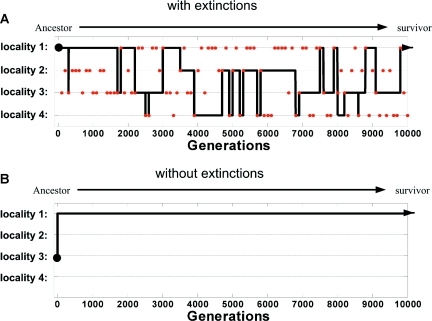
Figure 6.
Ancestral history in SMVG evolution transits between freed niches. Shown is a typical trajectory of the localities where the ancestors of a survival circuit evolved through generations. Data are shown for the best circuit from locality 1 at the end of 10,000 generations simulation. Vertical lines represent migration events. Red points represent extinction events. (A) With extinctions. (B) Without extinctions. Simulation was without recombinations, to allow following a pure nondivergent evolutionary path. Ex= 100 and Npop= 2500. Similar results were found with recombinations.

