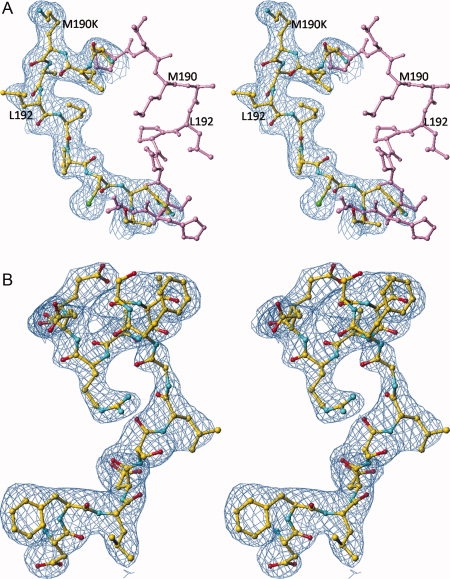
Figure 3.

Comparison of the structures of loop 187–194 in wt hTS (PDB entry 1hw3) shown in lavender and in M190K (in yellow). (a) The electron density, contoured at 1.0 σ level, is from the final map calculated for M190K with 2Fo-Fc coefficients. The side chain of Lys190 in entirely in solvent and does not form any contacts. (b) Stereoview of the electron density for a part of eukaryotic insert 1 in M190K. [Color figure can be viewed in the online issue, which is available at www.interscience.wiley.com.]
