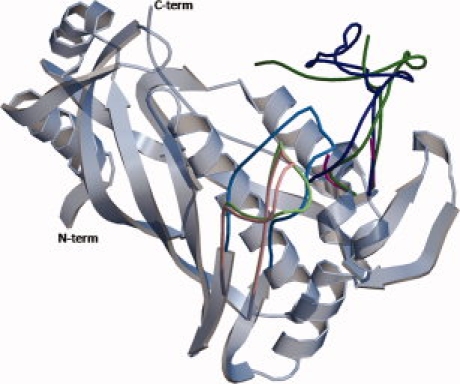
Figure 4.

Positions of the loops in hTS. In gray is shown the invariant part which is based on hTS-R163K (PDB entry 2rda). The loops that change their position upon conformational transitions are shown in colors. Loop 181–197 is shown in light blue in the active conformation (R163K), in light pink in the inactive conformation (wt-hTS), and in light green in the alternative inactive conformation (M190K). Loop 94–135 is in dark blue in the active conformation observed in R163K, in purple in wt-hTS (residues 108–128 are disordered), and in dark green in M190K (residues 104–114 are disordered). [Color figure can be viewed in the online issue, which is available at www.interscience.wiley.com.]
