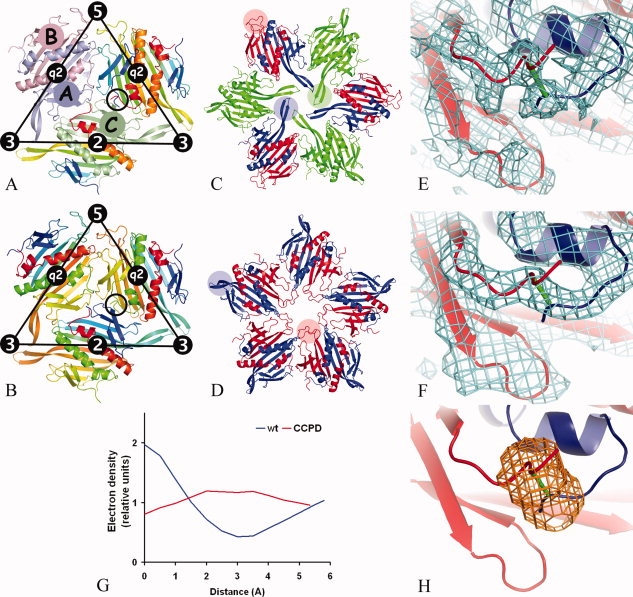
Figure 1.

Comparison of the icosahedral subunit arrangement of the wild-type MS2 coat protein (a) and the putative CCPD arrangement (b). The location of icosahedral symmetry elements is shown together with the borders of the icosahedral asymmetric unit. In (a), subunit A1 is painted light-blue, B5 light-red, C1 light-green, and the remaining subunits are rainbow colored from the N-terminus in blue to the C-terminus in red. The black circle indicates the position of the C-terminus of subunit A2 and the N-terminus of subunit B1, which are located in close proximity to each other. Wild-type MS2 subunits were used to represent the CCPD subunits in (b). The subunits were rainbow colored as if the dimer-forming subunits were one chain. For example, subunit A2 was colored from the N-terminus in blue to the C-terminus in yellow-green. The coloring then continues in subunit B1 starting from the N-terminus in yellow-green to the C-terminus in red. The N-terminus of B1 and the C-terminus of A2 in the black circle represent the position of the covalent intersubunit linker. The CCPD subunits represented by the A2B1 and A1B5 dimers have opposite directionality that makes the fivefold symmetry only approximate. Arrangement of MS2 coat protein subunits around threefold (c) and fivefold (d) symmetry axes. The subunits are colored as follows: A in blue, B in red, and C in green. FG loops of selected subunits are highlighted with transparent circles of corresponding color. Comparison of electron density between the N-terminus of the B subunit and the C-terminus of the A subunit from the icosahedral particle of wild-type VLP (e) and CCPD (f). The CCPD subunit is represented by wild-type subunits and the putative link between the subunits is shown in green (f). Subunit B is shown in red and subunit A in blue. Displayed parts of wild-type and CCPD subunits correspond to the circles in (a) and (b), respectively. (g) Electron density distribution along a line connecting atoms CA of residue A128 and N of residue B3 in wild-type and CCPD particles. The lines are shown in Figure 1(e,f), respectively. The interpolated values of electron density at given points were brought on relative scale by dividing by the average electron density for the respective structure. (h) A mask shoving a region that was used in comparison of the electron density distribution between the C- and N-termini of the subunits.
