
Figure 4.
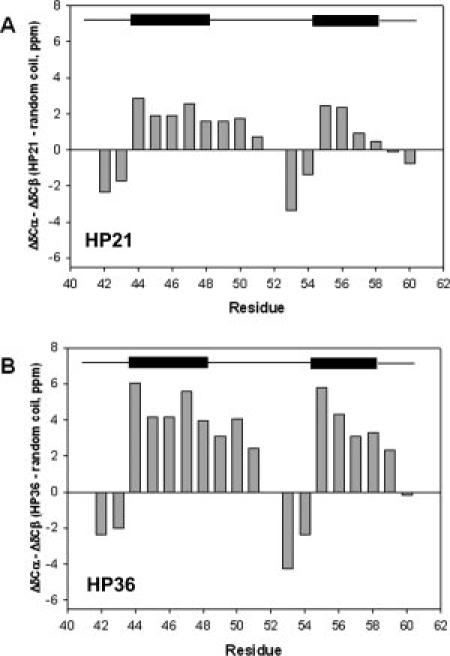
Plots of Δδ13Cα − Δδ13Cβ values for (A) HP21 and (B) HP36. A schematic diagram of the boundaries of the helices in the NMR structure of HP36 (PDB entry 1VII) is shown at the top. Positive values indicate α-helical propensity and negative values indicate β-strand structure propensity.