
Figure 7.
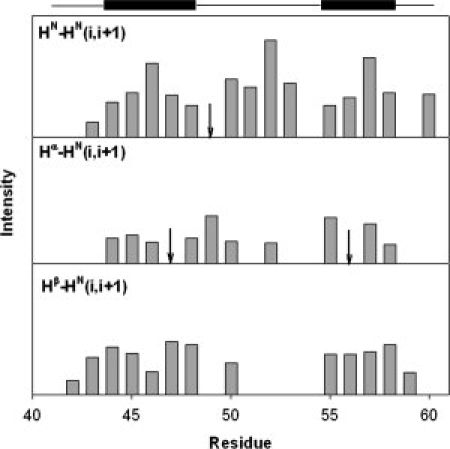
Summary of sequential NOEs observed for HP21 including HN-HN(i,i+1), Hα-HN(i,i+1) and Hβ-HN(i,i+1) obtained from a three-dimensional NOESY-HSQC spectrum of HP21. “↓” indicates that the corresponding NOEs were observed but their intensities could not be obtained accurately due to peak overlap. A schematic diagram of the boundaries of the helices in the NMR structure of HP36 (PDB entry 1VII) is shown at the top.