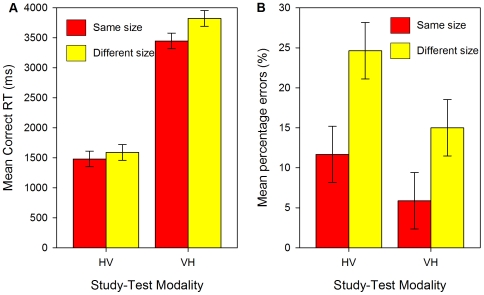
Figure 3. Results of Experiment 2: Crossmodal matching.
(a) Mean correct RTs (ms) and (b) mean percentage errors (%) for crossmodal, haptic-to-visual (HV) and visual-to-haptic (VH) matches in Experiment 2. Error bars show 95% within-participant confidence intervals calculated using the error term of the modality × size interaction [48], [49].

