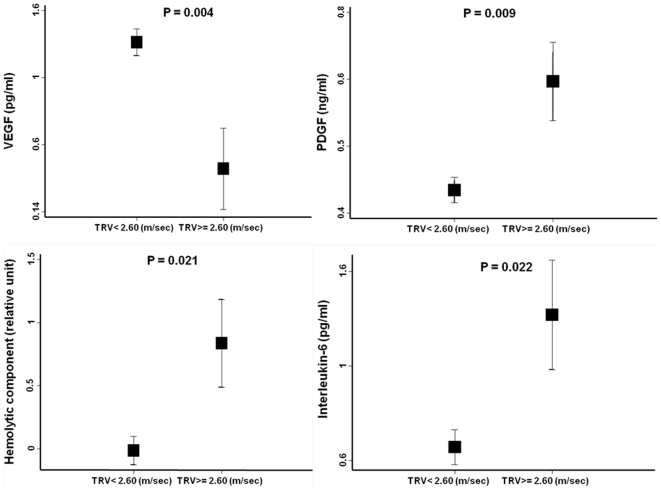
Figure 2. Adjusted mean values VEGF, PDGF-BB, interleukin-6 and hemolytic component according to tricuspid regurgitation velocity category.
Presented are least square mean (±standard error) values from ANOVA with adjustment for the other variables depicted. TRV indicates tricuspid regurgitation velocity.

