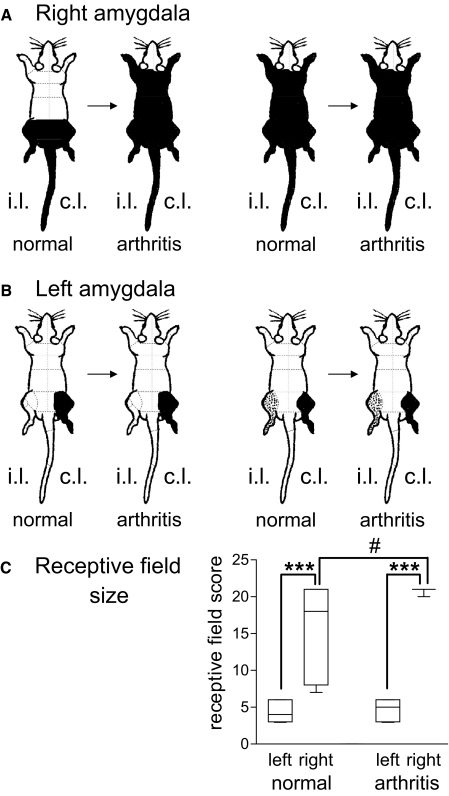
Fig. 2.
Receptive fields of neurons in the right (A) and left (B) CeLC. Receptive fields in the deep tissue are shown before (normal) and 5 h postinduction of arthritis. Changes of receptive field size were observed in right, not left, CeLC neurons. A and B: all neurons showed increasing responses to graded innocuous and noxious stimulation of areas colored black (= multireceptive neurons, see methods).  , high-threshold receptive fields, stimulation of which activated the neuron weakly. i.l., ipsilateral; c.l., contralateral to recording site. A: under normal conditions, receptive fields of right CeLC neurons (n = 15) were symmetrical in the deep tissue of both hindlimbs and the tail (n = 7, left) or covered the whole body (n = 8, right). B: receptive fields of left CeLC neurons (n = 17) were either confined to the contralateral hindlimb (n = 9) or included an additional high-threshold receptive field in the ipsilateral hindlimb (n = 8). C: semi-quantitative analysis of the receptive field size in neurons that were recorded continuously before and after arthritis induction. The body map was divided into 21 areas (A and B, - - -). The total number of areas that contained part of the receptive field was calculated for each neuron and averaged for left (n = 11) and right (n = 9) CeLC neurons (see Data analysis). Only neurons that were recorded before and after arthritis induction are included in the analysis. In the graph, each box extends from the 25th to the 75th percentile, with a line at the median (50th percentile). The whiskers extend above and below the box to show the highest and lowest values. ***, P < 0.0005 (receptive field size of right compared with left CeLC neurons; Mann-Whitney U test), #, P < 0.025 (receptive field size after arthritis compared with normal; Wilcoxon signed-rank test), alpha level adjusted for multiple comparisons.

