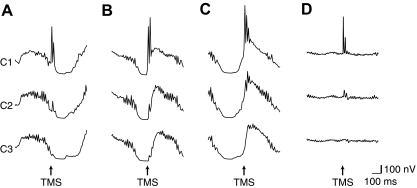
FIG. 6.
A simulated TMS pulse was delivered to C1 on entry into a downstate (A), during the middle of the downstate (B), or on exit from the downstate (C). For comparison purposes, the response to TMS delivered to C1 during an upstate is also depicted (D). The EEG from all 3 cortical areas is depicted to show the response evoked by this stimulation.

