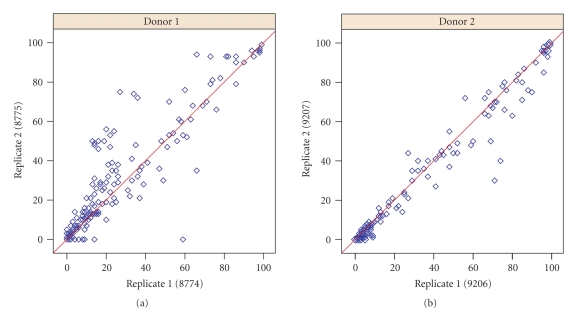
Figure 2.
FlowJo estimates for the percentage of cells above the isotype threshold for 189 markers on replicate plates for donor 1 and donor 2. Estimates from markers where the center of the cell population was near the isotype threshold, around 50%, were more variable than samples which were clearly positive (≥99%) or negative (≤1%). The correlation for replicate plates was strong in both donors, with donor 1 at 0.92 and donor 2 at 0.98. Plate 9208 for donor 2 is not shown, since the results are very similar to 9206 and 9207.

