
Figure 5.
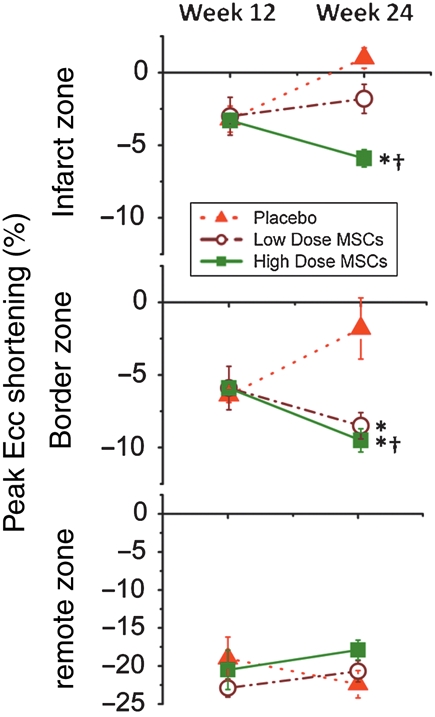
Plots of peak circumferential shortening (peak Ecc) in the infarct, border, and remote zones. Peak negative Ecc values represent myocardial shortening and increased contractility, whereas increasingly positive values indicate myocardial dysfunction. Ecc improves after cell therapy in both low- and high-dose cell groups in infarct border zones. In contrast, Ecc improves in infarct zones only in the high and not the low-dose MSC group. (*P < 0.05 vs. placebo, †P < 0.05 week 12 vs. week 24).