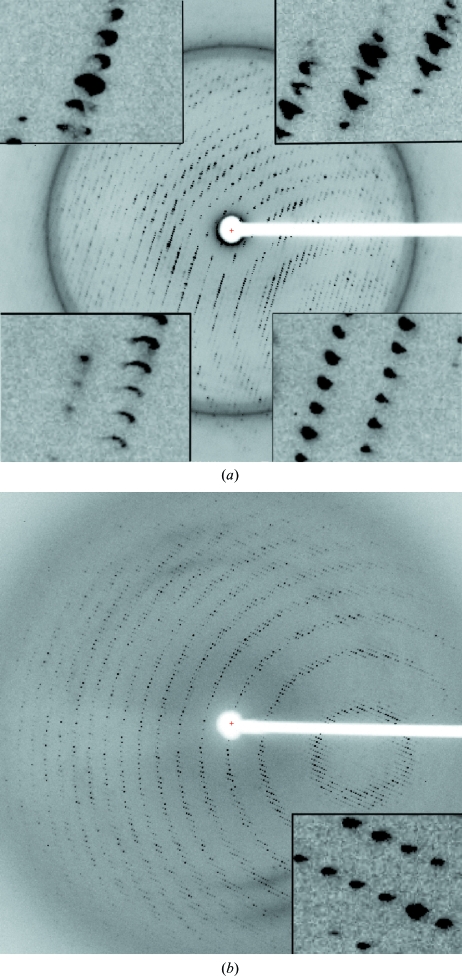
Figure 3.
Diffraction patterns taken from PepcA crystals. (a) An 0.4° oscillation from the native data set, with insets in the image showing the variation of spot shape across the detector. The resolution at the detector edge was 3 Å. (b) An 0.75° oscillation from the KAu(CN)2-soaked crystal. The resolution at the detector edge was 3.13 Å.

