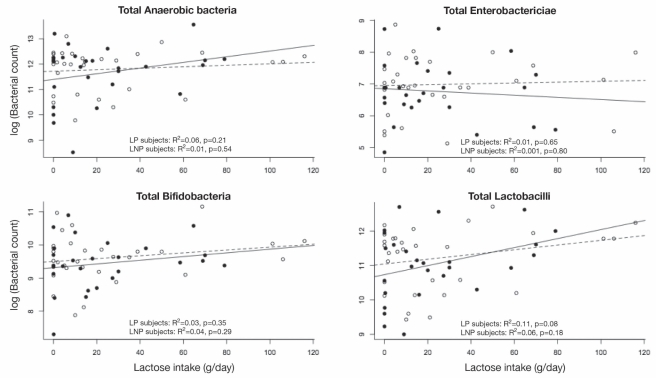
Figure 2).
The log10 of bacterial counts are plotted against the daily lactose intake for each of the different types of bacteria. The results for lactase persistent (LP) subjects are plotted as solid circles, and the regression line for LP subjects is plotted as a solid line. The results for lactase nonpersistent (LNP) subjects are shown as open circles and a dashed line. Multiple regression analyses for the relationship between each of the bacterial counts and lactose intake failed to show an effect of dairy food, genetic status or an interaction between lactose intake and genetic status

