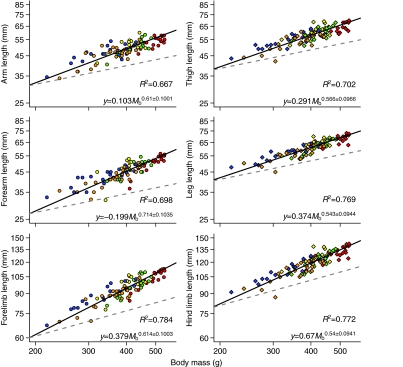
Fig. 3.
Allometry of limb growth in Saimiri boliviensis. Data are plotted on log–log axes. Black lines indicate the calculated reduced major axis (RMA) slopes for each segment computed across individuals. Dashed gray lines indicate isometry. Forelimbs and forelimb segments are represented by circles whereas hind limbs and hind limb segments are represented by diamonds. Color codes for individual monkeys follow Fig. 1. Graphs are plotted on the same scale to indicate absolute differences in segment length. Allometric regression equations and coefficients of determination (i.e. R2 values) are provided for each relationship at the bottom of the plot.

