Figure 4.
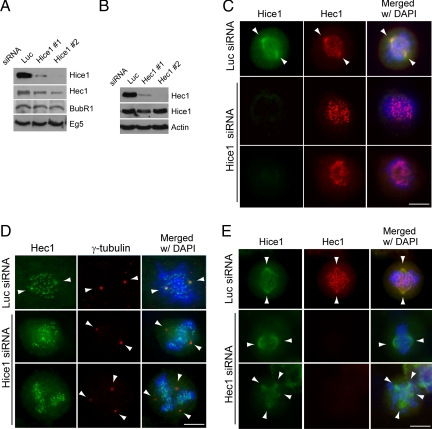
Depletion of Hice1 led to diminished Hec1 signal at the centrosome. (A) Western blot analysis of U2OS cells with indicated antibodies after depletion of Hice1 by using two different siRNAs (1 and 2). (B) Western blot analysis of U2OS cells after depletion of Hec1 using two different siRNAs (1 and 2). (C) Immunofluorescence staining for Hice1 and Hec1 in luciferase or Hice1 siRNA-treated mitotic U2OS cells. (D) Immunofluorescence staining for Hec1 and γ-tubulin in luciferase or Hice1 siRNA-treated mitotic U2OS cells. Note the spindle distribution of Hec1 (colocalization with Hice1 and γ-tubulin) and the numerous chromosome-associated Hec1 speckles corresponding to kinetochores. (E) Immunofluorescence staining for Hec1 and Hice1 in luciferase or Hec1 siRNA-treated mitotic U2OS cells. For C–E, arrowheads indicate the spindle pole position. Bars, 10 μm.

