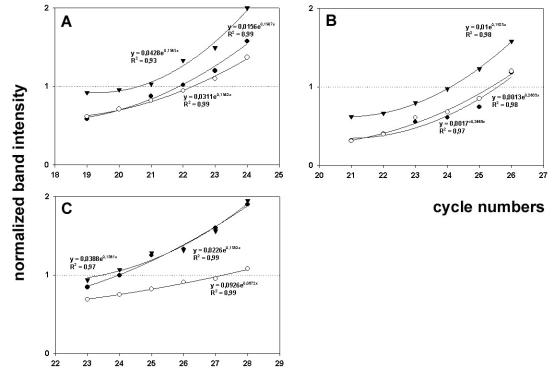
Fig. 3. SM-PCR for HSP2A (A), MSF-B (B) and KIAA0309/SRCAP (C).

Representative plots of normalized data vs. cycle numbers fit with an exponential curve for 8701-BC cells cultured onto type IV (●), type V (○) and OF/LB (▼) collagen substrates.

Representative plots of normalized data vs. cycle numbers fit with an exponential curve for 8701-BC cells cultured onto type IV (●), type V (○) and OF/LB (▼) collagen substrates.