Figure 2.
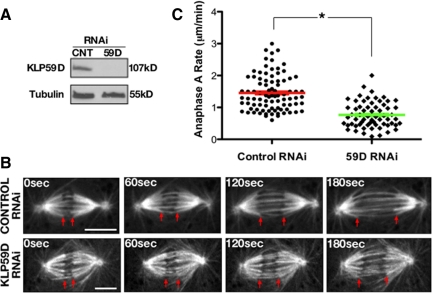
KLP59D drives anaphase A. (A) Western blots of lysates from S2 cell cultures treated with control (CNT) or KLP59D RNAi and probed with antibodies against KLP59D or α-tubulin (loading control). (B) Time-lapse images of anaphase A in control and KLP59D RNAi-treated S2 cells stably expressing eGFP-α-tubulin. Red arrows track the segregating chromatids, which appear as dark, negatively stained objects at the ends of k-fibers. Scale bars, 5 μm. (C) Anaphase A rates from each condition. Each symbol (●, ♦) represents the averaged anaphase A rate from a single spindle, and the red and green bars mark the overall average from each condition. Error bars, SEM. Significant difference between the two treatments; *p < 0.001.

